


Peak of Atlantic Hurricane Season
Historical climatology from the National Hurricane Center — not a forecast for this specific season.
Loading…
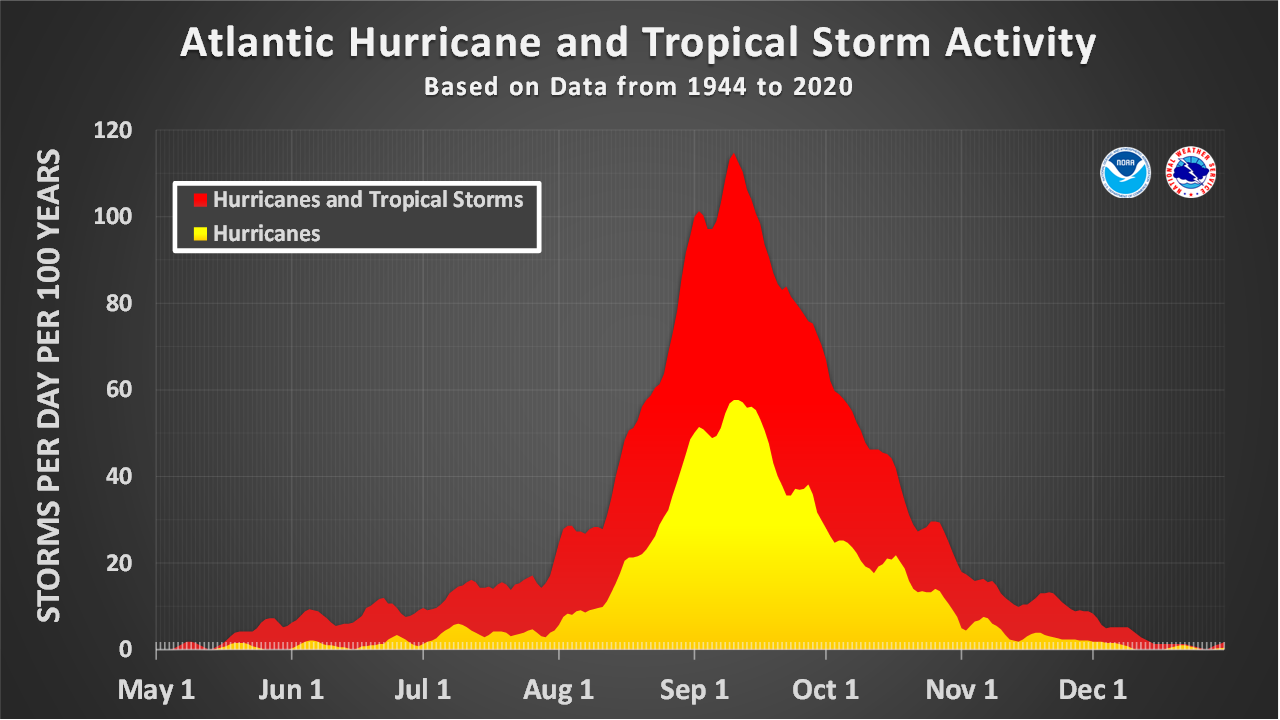
Named storms (red) and hurricanes (yellow) by calendar day, based on a 77-year (1944–2020) NOAA climatology normalized to 100 years. Source: NHC Tropical Cyclone Climatology.
Jun 1
Season starts
Sep 10
Statistical peak
Nov 30
Season ends
14 / 7 / 3
Avg. named storms / hurricanes / majors (1991–2020)
Average pace of a season (1991–2020 climatology)
| Milestone | Typical date |
|---|---|
| 1st named storm | Jun 20 |
| 1st hurricane | Aug 11 |
| 1st major hurricane (Cat 3+) | Sep 1 |
| 7th named storm | Sep 3 |
| 14th (average season total) named storm | Nov 19 |
Source: all figures and the chart above come directly from the NHC's Tropical Cyclone Climatology page — historical averages, not a prediction of what this particular season will do. Most Atlantic activity falls between mid-August and mid-October, with the single most likely day to find an active system somewhere in the basin being September 10th.
This is climatology, not a current forecast. For what's actually happening right now, see your live Tropical Weather Outlook widget, or nhc.noaa.gov directly.
This is climatology, not a current forecast. For what's actually happening right now, see your live Tropical Weather Outlook widget, or nhc.noaa.gov directly.
ORBIS·WEATHER
Atlantic Basin
LIVE
--:--:-- UTC
Rain
Wind
Temperature
Satellite
Live image unavailable right now.
View directly on NOAA / NESDIS / STAR.
View directly on NOAA / NESDIS / STAR.
Tropical Weather Outlook — Atlantic & Gulf
Live graphics straight from the National Hurricane Center — covers all of Florida's Gulf/Atlantic basin, not just Naples/Marco Island specifically.
2-Day Outlook

7-Day Outlook

Current storms & official advisories
- NHC homepage — full list of active systems, advisories, and watches/warnings
- Full Graphical Tropical Weather Outlook (interactive, zoomable)
- Atlantic basin RSS feed — for auto-updating alerts elsewhere on your site
- NWS Tallahassee / NWS Miami — local forecast offices covering Southwest Florida
Source: these are the same live outlook graphics published on nhc.noaa.gov, embedded directly as images — no API key, no cookies, updates automatically whenever NHC issues a new outlook (roughly every 6 hours, more often during active storms). A small script appends a cache-busting parameter so your browser doesn't hold onto a stale image between visits.
Important: this shows the basin-wide outlook, not a Marco Island/Naples-specific forecast — a shaded area or storm on the map doesn't necessarily mean Southwest Florida is in its path. For anything with a real chance of affecting this area, always confirm against NHC's own advisories and your local National Weather Service office rather than relying on this page alone.
Important: this shows the basin-wide outlook, not a Marco Island/Naples-specific forecast — a shaded area or storm on the map doesn't necessarily mean Southwest Florida is in its path. For anything with a real chance of affecting this area, always confirm against NHC's own advisories and your local National Weather Service office rather than relying on this page alone.